Health Risk Scores: how they’re calculated, why they matter, and what to do with them
- Dr Duy Dinh

- Aug 25
- 5 min read
Updated: Aug 27
Summary
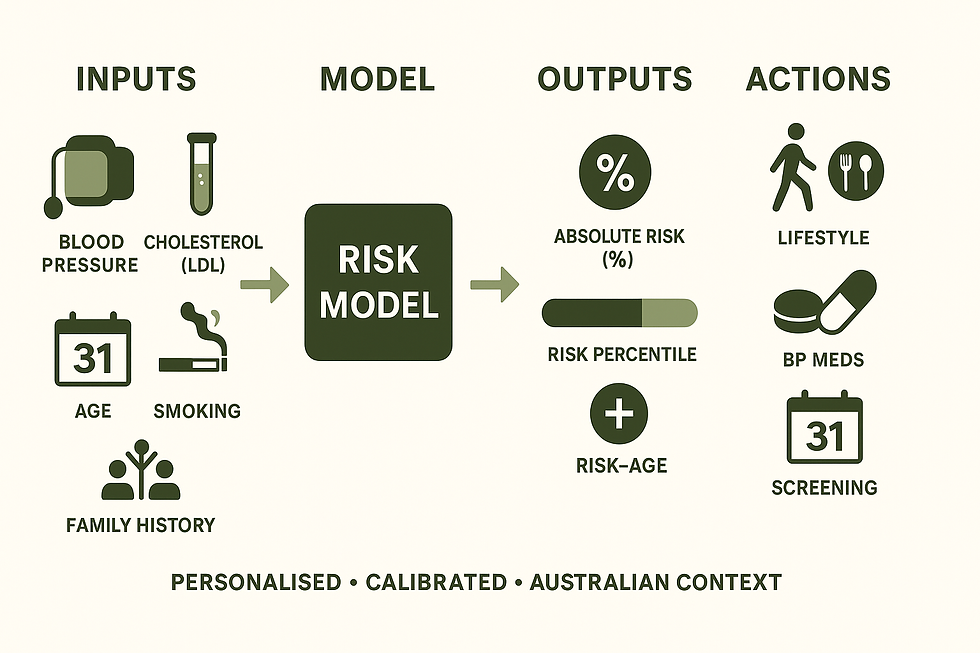
Health risk scores turn your history, blood pressure, cholesterol and other factors into an absolute risk of events (heart attack, stroke, diabetes, fracture) using validated models. We interpret results with calibration to Australian data, population percentiles/“risk-age,” and your goals. Used well, scores guide screening and prevention; used alone they can mislead. If your score is high, targeted lifestyle, BP and lipid therapy, and appropriate screening reduce risk. Book a personalised preventive telehealth consult—your long-term partner in care.
Jump to Sections:

Health risk scores estimate an individual’s probability of experiencing a defined outcome (e.g., a heart attack, stroke, fracture, diabetes) over a set time horizon. They turn a person’s risk factors into a single, actionable number that supports shared decision-making—when used with clinical judgement. BMJ
How risk scores are built (and judged)
Most widely used scores were derived from large cohort studies using multivariable regression or survival models. Good models report and test:
Discrimination (can the model separate higher- from lower-risk people?—often the c-statistic/AUC),
Calibration (are predicted probabilities close to observed event rates in the target population?), and
Clinical utility (does using the model improve decisions or outcomes). JAMA NetworkBMJOxford Academic
Because performance can drift in new settings or eras, external validation and periodic updating are essential before a score is used to guide care in a different population. Poorly calibrated tools can be misleading. PLOSBioMed Central
Examples you may encounter in routine care
Cardiovascular disease (CVD):
Pooled Cohort Equations (PCE)—the 2013 ACC/AHA tool to estimate 10-year ASCVD risk. Widely used, but several validations show miscalibration in some groups. AHA Journals, JAMA Network, JAMA Network
QRISK3—UK primary care model incorporating additional risk factors (e.g., migraine, steroids, SLE). BMJ
AHA PREVENT equations (2023)—newer equations that remove race and better fit contemporary data; related risk-age metrics can express risk as an equivalent “heart age.” AHA Journals, JAMA Network
Type 2 Diabetes:
FINDRISC—an eight-item, non-lab questionnaire predicting 10-year diabetes risk. Diabetes Journals
Fracture/Osteoporosis:
FRAX—computes 10-year major osteoporotic and hip fracture probability using clinical risk factors, with or without femoral neck BMD. SpringerLink
Breast cancer:
Gail model (BCRAT)—estimates 5-year and lifetime invasive breast cancer risk using reproductive and family history. Oxford Academic
Peri-operative risk:
ACS-NSQIP Surgical Risk Calculator and Revised Cardiac Risk Index (RCRI) help estimate post-operative and cardiac complication risks. maguire-lab.github.ioAHA Journals
Important: A model’s “headline number” is only as good as its calibration in people like you—by age, sex, ethnicity, comorbidity burden, and country. Recalibration to local populations is often needed. BioMed Central
Why knowing your score matters
Guides prevention intensity. Absolute risk frames whether to prioritise lifestyle measures alone or add medications (e.g., statins, antihypertensives). Large meta-analyses and trials show meaningful event reduction when treatment is targeted by absolute risk. The LancetNew England Journal of Medicine
Turns numbers into motivation. Communicating risk-age (e.g., “heart age”) helps patients grasp risk and act. JAMA Network
Optimises screening. Scores help decide who benefits most from earlier, more frequent, or additional tests (e.g., bone density for high FRAX, mammography pathways for elevated Gail risk). SpringerLinkOxford Academic
How we compare an individual with the broader population
Your predicted absolute risk can be contextualised with age- and sex-specific percentiles or a risk-age translation (expressing your risk as the typical risk of someone older or younger). Modern CVD tools provide equations to compute risk-age directly from your 10-year risk, enabling clear comparisons with population norms. JAMA Network

Pitfalls without professional guidance
Miscalibration and overestimation. Classic tools can over-predict risk in some groups and eras; updating or alternative models may be preferable. JAMA NetworkJAMA Network
Data quality and timing. Out-of-date lipids, home BP not averaged correctly, or unrecorded conditions skew results; clinical review ensures inputs are valid. BMJ
Model scope. Each score targets specific outcomes and time frames; using the wrong tool (or combining scores naively) can prompt unnecessary therapy. BMJ
Ignoring patient goals and competing risks. A number without discussion of preferences, life expectancy, pregnancy plans, or comorbidities risks both overtreatment and undertreatment. Decision-curve approaches highlight when using a model truly improves decisions. Oxford AcademicBioMed Central
What if your health risk score is higher than average?
Evidence-based, stepwise action—tailored to your circumstances—can markedly reduce risk:
Lifestyle intervention with coaching. Structured programs reduce incident diabetes and improve cardiometabolic risk. New England Journal of Medicine
Lipid lowering when indicated. Each 1 mmol/L LDL-C reduction with statins lowers major vascular events by ~20–25%, with benefits across ages and sexes. The LancetThe Lancet
Blood pressure optimisation. Treating to more intensive systolic targets (where appropriate) reduces CVD events and mortality; decisions are individualised to potential benefits and harms. New England Journal of Medicine
Targeted screening or diagnostics. Examples include bone density testing when FRAX is elevated or enhanced breast screening pathways when Gail risk is high. SpringerLinkOxford Academic
Our clinicians interpret scores in context—we audit calibration against Australian practice, reconcile conflicting models, and translate results into a plan that fits your goals and life stage. BMJ
Work with us: prevention as a lifelong partnership
If you’re curious—or concerned—about your risk numbers, book a consultation with our preventive telehealth doctors. We don’t just generate a score; we build an ongoing plan with you:
Confirm accurate inputs (labs, BP, history) and choose the right model for your situation.
Put your result in plain language (including risk-age and percentiles) and align it with your priorities—family, career, sport, or healthy ageing.
Provide a personalised roadmap (lifestyle, screening, and medications where indicated) and track progress over time.
Ready to turn your numbers into a longer, healthier life? ❇️ Book your appointment—we’ll look after you now and for the long haul.
Key references (medical journals)
Model development & evaluation: TRIPOD Statement (BMJ 2015); Users’ Guide on discrimination and calibration (JAMA 2017); Evaluation of prediction models (BMJ 2024). BMJJAMA NetworkBMJ
CVD risk: ACC/AHA Pooled Cohort risk guideline (Circulation 2013); External validation and calibration (JAMA 2014; JAMA Netw Open 2020); QRISK3 (BMJ 2017); PREVENT equations & risk-age (Circulation 2023; JAMA Cardiol 2025). AHA JournalsJAMA NetworkJAMA NetworkBMJAHA JournalsJAMA Network
Diabetes: FINDRISC (Diabetes Care 2003). Diabetes Journals
Fracture: FRAX (Osteoporosis International 2008). SpringerLink
Breast cancer: Gail model/BCRAT (JNCI 1989). Oxford Academic
Surgery: ACS-NSQIP surgical risk calculator (JACS 2013); RCRI (Circulation 1999). maguire-lab.github.ioAHA Journals
Interventions tied to risk: CTT statin meta-analyses (Lancet 2012/2019); SPRINT BP trial (NEJM 2015); Diabetes Prevention Program (NEJM 2002). The LancetThe LancetNew England Journal of MedicineNew England Journal of Medicine


Comments